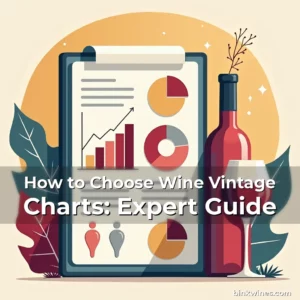
Wine Vintage Charts: Essential Tools and Resources
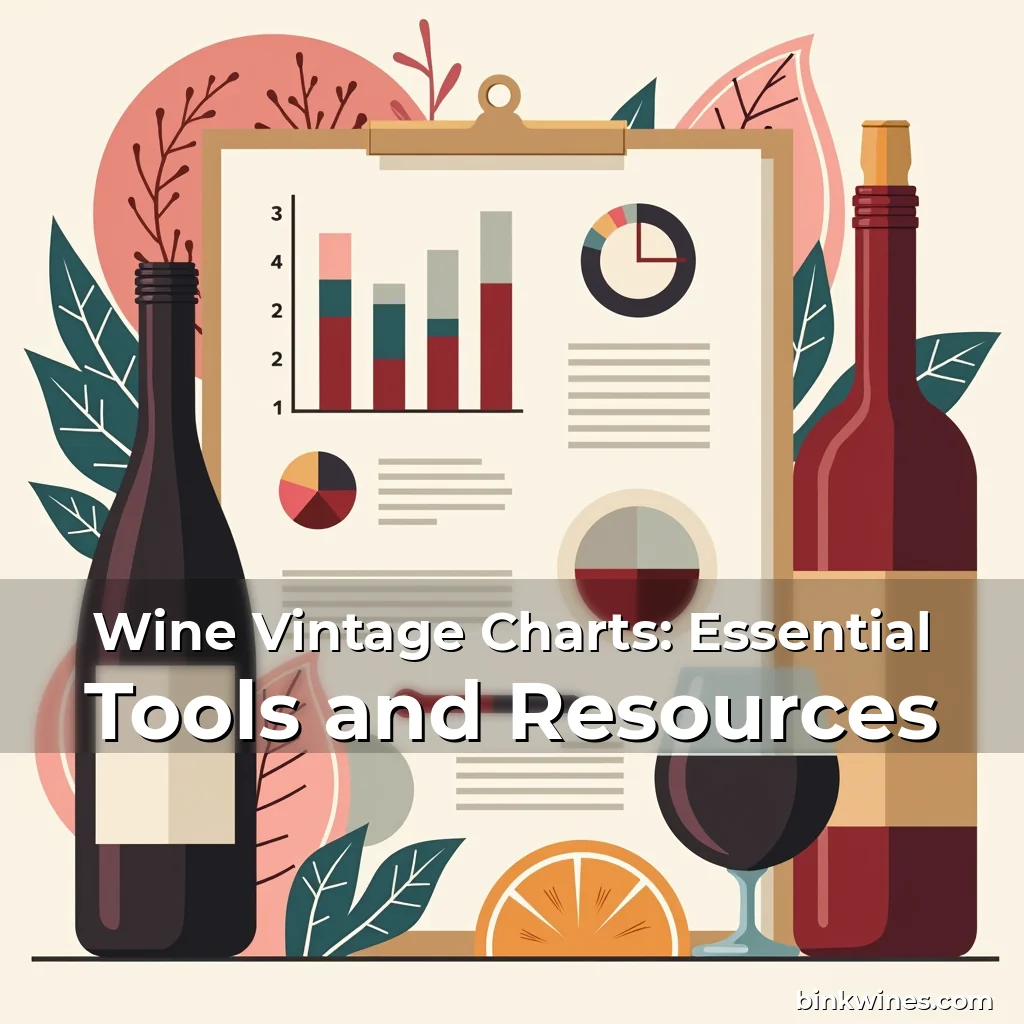
Wine vintage charts serve as vital navigational guides for connoisseurs, collectors, and casual drinkers alike. These visual representations capture the nuances of climate conditions, harvest years, and quality ratings across different regions. Understanding these charts allows you to make informed decisions when selecting bottles.
Whether you’re investing in fine wines or simply enjoying a glass at home, mastering the language of vintage charts enhances your appreciation. This guide explores the intricacies of interpreting these charts, along with top-rated tools and resources for accessing them.
The Significance of Wine Vintage Charts
Vintage charts provide a historical snapshot of wine production, revealing patterns influenced by weather, soil health, and winemaking techniques. A single year can determine whether a bottle becomes a coveted collector’s item or a disappointing purchase.
These charts also help identify exceptional vintages that stand out due to favorable growing seasons. By studying past decades, experts predict which years may yield superior wines, offering guidance to both novices and seasoned enthusiasts.
- Climatic Influence: Weather anomalies such as droughts or excessive rain drastically affect grape quality and quantity.
- Harvest Conditions: Late frosts or early heatwaves during ripening phases often result in lower yields but higher concentration of flavors.
Decoding the Language of Vintage Ratings
To interpret vintage charts effectively, familiarize yourself with rating systems like those from Robert Parker’s Wine Advocate or Wine Spectator. These scores reflect the taster’s assessment of aroma, flavor profile, and overall balance.
Some charts incorporate color-coded indicators representing different levels of quality. Green might denote average years, yellow for above-average, and red for outstanding vintages. Learning to decode these symbols ensures quick reference when browsing selections.
Regional Variations in Rating Systems
Different countries employ distinct methodologies for evaluating vintages. In France, classifications such as Cru Bourgeois or Grand Cru Classe rely heavily on tradition rather than numerical scores alone. Meanwhile, New World producers tend toward more transparent scoring practices.
This diversity underscores the importance of cross-referencing information from multiple sources. Combining traditional French hierarchies with contemporary American or Australian reviews offers a well-rounded perspective.
Tools and Platforms for Accessing Vintage Data
A wealth of online platforms provides easy access to vintage charts. Websites like Vinfolio or CellarTracker aggregate data from various critics, allowing users to compare ratings side-by-side. Subscription-based services offer deeper analytics features suitable for serious investors.
Beyond digital archives, physical books remain invaluable resources. Publications like “The Oxford Companion to Wine” contain extensive vintage tables spanning centuries. Libraries and specialty stores still stock these timeless references alongside newer editions.
Building Your Own Vintage Chart Collection
Curating personal records helps track preferred vintages over time. Many consumers maintain spreadsheets noting tasting notes, price fluctuations, and aging potential for each bottle acquired. This practice deepens understanding through repeated exposure.
Joining local wine clubs expands knowledge sharing opportunities. Members often exchange insights about recent vintages, uncovering hidden gems overlooked by mainstream publications. Networking fosters continuous learning beyond formal education channels.
Technology Enhancing Vintage Analysis
Advancements in AI technology now enable predictive modeling of future vintages. Algorithms analyze satellite imagery showing vineyard conditions months ahead of harvest season. Such innovations empower growers to optimize planting schedules and resource allocation.
Mobile apps integrate real-time data feeds from sensors monitoring temperature, humidity, and soil composition. These devices transmit alerts regarding impending threats like frost events or disease outbreaks, safeguarding crops proactively.
Common Misconceptions About Vintage Charts
One widespread belief holds that higher numbered vintages always equate to better quality. However, context matters significantly; a high score in Burgundy might mean something entirely different compared to Napa Valley standards.
Another fallacy assumes consistency across varietals within the same region. Pinot Noir typically requires cooler climates than Cabernet Sauvignon, meaning optimal vintages differ even among neighboring vineyards cultivating similar grapes.
Evaluating Vintage Quality Through Historical Context
Examining long-term climatological trends reveals cyclical patterns affecting viticulture. Decades-long studies show correlations between El Niño phenomena and reduced acidity levels in certain white wines harvested during warm spells.
Archival research into past vintages aids in recognizing recurring issues plaguing particular areas. For instance, coastal regions frequently face challenges related to sea spray damage during humid summers—a factor reflected consistently across decades worth of vintage reports.
Trends Shaping Future Vintage Assessments
Sustainability initiatives increasingly influence how vintages are evaluated today. Organic farming certifications now appear alongside traditional metrics, signaling environmentally conscious production methods favored by eco-conscious buyers.
The rise of natural wines emphasizes minimal intervention approaches, altering expectations around consistency and shelf life. Vintage charts reflecting this movement highlight experimental batches produced under less controlled conditions.
Conclusion
Mastery of wine vintage charts transforms casual drinking experiences into informed choices backed by thorough analysis. Whether consulting digital databases or poring over aged paper copies, these tools elevate enjoyment through enhanced comprehension of what makes each bottle special.
As you explore new vintages, remember that no chart replaces firsthand experience. Pair technical knowledge gained from studying vintage data with sensory evaluations to develop a nuanced palate capable of appreciating subtleties otherwise missed.
news is a contributor at BinkWines. We are committed to providing well-researched, accurate, and valuable content to our readers.